.jpg)
What Counts As An SEO Reporting Tool?
An SEO reporting tool takes data and turns it into something useful to the people who are making decisions from it. That sounds simple enough, until you look at the products that are being compared under that label.
For the B2B companies we work with, the distinction matters because choosing the wrong type of tool rarely fixes the reporting problem. It simply adds another subscription to the stack.
This guide uses a hard boundary. Report builders, dashboards, data connectors and genuine reporting modules are in scope. Tools primarily designed to research, audit or track search performance are not.
The Scope Problem
Search for the best SEO reporting tools and you will find products that have little in common beyond the fact they all touch SEO data.
Data Studio is a free reporting and dashboard product. Ahrefs is a research platform that generates proprietary backlink, keyword and competitive intelligence. Putting them side by side without explaining the difference leaves the buyer comparing two products that are built to solve different problems.
The same thing happens with data connectors, rank trackers and AI visibility platforms. They might all contribute information to an SEO report, but that doesn’t necessarily mean they are interchangeable.
That distinction becomes important when money enters the equation. A team looking for a cleaner way to present data it already has doesn’t necessarily need another platform to generate more of it. Equally, a dashboard builder can’t replace the research platform supplying the underlying intelligence.
So this article defines the reporting layer first.
Only then does it compare the tools inside it.
Four Categories
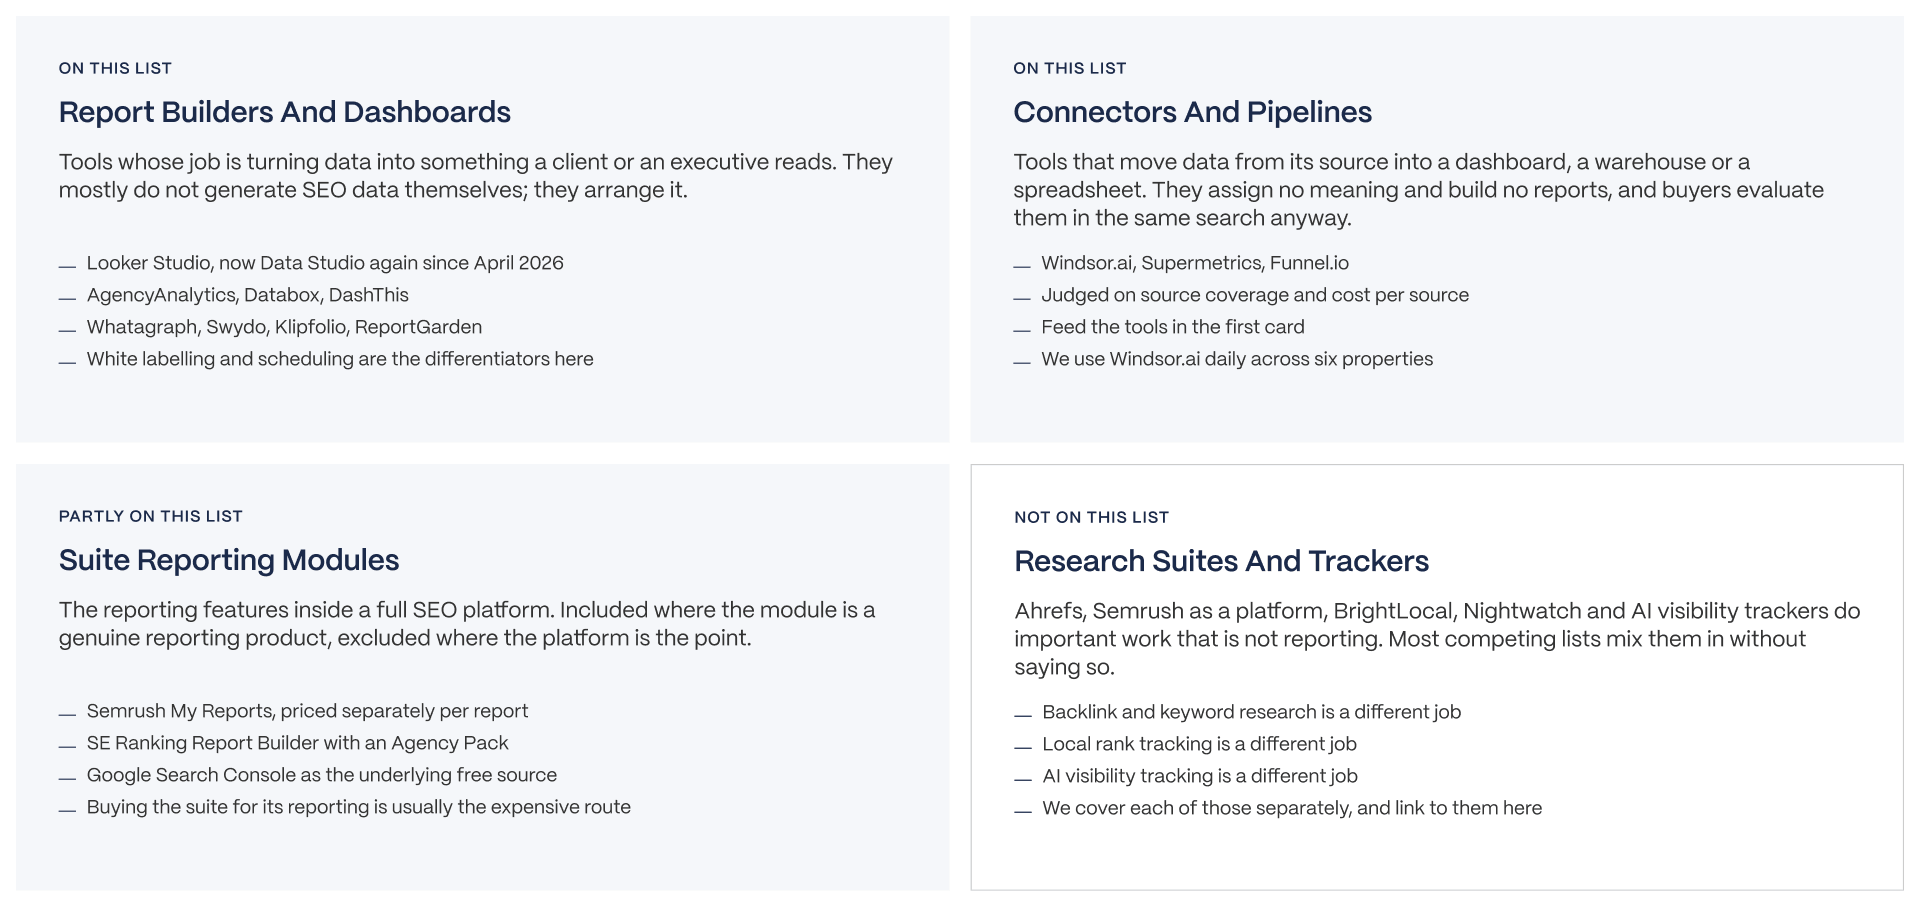
There are four categories worth separating before you build a shortlist.
Report builders and dashboards take existing data and turn it into reports people can read. Data Studio, AgencyAnalytics, Databox and DashThis sit here. Scheduling, templates, white labeling and presentation are core differentiators.
Connectors and pipelines move data from one place to another. Windsor.ai, Supermetrics and Funnel.io can feed Search Console, GA4 and other sources into dashboards, spreadsheets, or warehouses. They solve the plumbing problem as opposed to the presentation problem.
Suite reporting modules sit inside larger platforms. Semrush My Reports and SE Ranking Report Builder qualify because reporting is a distinct function within the wider product. Google Search Console also belongs in the discussion as the free underlying data source many of these products ultimately read from.
Then there are research suites and trackers. These generate or track information that did not previously exist in your reporting stack. They are useful, but they solve a different problem.
The simplest test here is:
Does the tool mostly arrange data that already exists, or does it mostly produce data that didn’t exist before?
Data Studio mostly arranges. Ahrefs mainly produces.
What is Not On This List, And Where to Read About It
Excluding a tool from this list doesn’t mean we think it’s bad. It means buying it primarily for reporting would put it in the wrong comparison.
Ahrefs and Semrush as a whole are research suites. They belong to a much broader comparison of SEO tools, as opposed to beside dedicated report builders.
The same applies to crawling and auditing platforms. If the problem you’re trying to solve is finding technical issues as opposed to presenting existing performance data, our guide to website audit tools covers this category separately.
BrightLocal and Nightwatch primarily track rankings, including local search performance. Again, tracking and reporting can overlap, but the core job differs.
AI visibility platforms are a separate category again. They monitor how brands appear across AI search and answer engines, and we cover this in our guide to AI SEO tools.
Keeping those categories separate matters because the reporting layer should answer narrower questions: how do you turn the data you have into a report someone can actually use?
That’s the question the next 14 tools are being judged against.
The Tools
Once you separate reporting tools from research platforms, the shortlist becomes much easier to understand.
The 14 options below still do different jobs. Some build polished client reports. Some create executive dashboards. Others move data between systems or add reporting functionality to a larger SEO suite. Google Search Console sits underneath much of the category as the free source supplying the data.
So this is not a ranking from one to fourteen. The useful comparison is what each product does, how it charges, and whether this matches the reporting problem you’re trying to solve.
The Comparison Table
Price gets the majority of the attention when SEO reporting tools are compared, but Type is the column to check out first.
A connector and a report builder are different purchases. Windsor.ai, Supermetrics, and Funnel.io move data between systems. They do not replace the reporting layer that turns that data into something a client or executive can consume.
The pricing models are just as different. Some tools charge per client, others per dashboard, data source, subscription tier or proprietary usage unit. A cheaper headline price can result in a more expensive option once the actual configuration is applied.
Five notes.
One. The Type column is the one to sort by. A connector and a report builder are different purchases and buying the wrong one is the most common mistake in this category. Windsor.ai, Supermetrics and Funnel.io move data. They do not build reports. Pair them with a report builder.
Two. Windsor.ai carries our disclosure. We use it daily to pull Search Console and GA4 across six brand properties. That is one tool out of fourteen here. Everything else is assessed from vendor documentation and dated third-party sources.
Three. Pricing models differ in kind, not just amount, and the entry price hides it. AgencyAnalytics charges per client, DashThis per dashboard, Databox and Swydo per data source, Whatagraph on source credits, Funnel.io on flexpoints, and Windsor.ai on data sources with monthly active row overage. Model your own configuration rather than comparing headline numbers.
Four. AgencyAnalytics moved to a flat per-client model in May 2026. Older tiered figures (Freelancer $59 to $79, Agency $179 to $229) still appear in third-party reviews and are stale.
Five. Funnel.io closed its free plan to new users in December 2025 and raised Starter to $400 per month in February 2026. Any article still showing a Funnel free tier is out of date.
Five notes before using the table:
- Sort by Type first. If your data is already connected and your reports are poor, you probably need a builder. If your data is stranded across different systems, you may need a connector.
- Windsor.ai is the one tool here we use ourselves. Veza uses it to pull Search Console and GA4 data across six brand properties. That’s first-hand experience with one tool out of fourteen. Everything else is assessed using vendor documentation and dated third-party sources.
- Model your configuration rather than comparing entry prices. Count your clients, dashboards and data sources first. Then be sure to calculate what each tool would cost for your setup.
- AgencyAnalytics changed its pricing model in May 2026. It now charges a flat $20 per client per month when billed annually. Older Freelancer and Agency tier prices still circulating online are stale.
- Funnel.io pricing has also changed significantly. Its free plan closed to new customers in December 2025, and its current model uses flexpoints. Treat older comparisons showing a free Funnel tier as outdated.
Report Builders and Dashboards
Data Studio
What is it: Google’s free dashboard and reporting builder, renamed back from Looker Studio to Data Studio in April 2026.
White labelling: No
Entry price: Free. Data Studio Pro costs $9 per user, per project, per month.
Entry limits: The free product carries more of the setup and administration burden, while Pro adds organizational and support features.
The limitation: Data Studio gives you flexibility as opposed to a finished client-reporting workflow. That makes it excellent value for teams willing to build and maintain their own dashboards, but less appealing when speed and polish are priorities.
AgencyAnalytics
What it is: A client reporting platform designed around agency workflows, with automated reports, dashboards, client portals, and 85+ integrations.
White labelling: Yes, included.
Entry price: $20 per client per month when billed annually.
Entry limits: Cost scales directly with the number of clients. Rank Tracker and AI Tracker are separate paid add-ons.
The limitation: The simplicity of per-client pricing is also its trade-off. As the client roster grows, reporting cost grows with it. Agencies should model the price against their expected client count instead of their current one.
Databox
What it is: A KPI dashboard platform built particularly well for executive-facing reporting rather than merely SEO reporting.
White labelling: Available as a paid agency feature.
Entry price: Free for basic use. Agency Starter is $71 per month when billed annually and includes three data sources.
Entry limits: The number of included data sources is intentionally small at entry level, so teams that combine several marketing platforms can hit these limits quickly.
The limitation: Databox becomes more expensive as source requirements increase. Its strength is making performance legible to executives, not producing traditional white-label SEO reports as cheaply as possible.
DashThis
What it is: A straightforward marketing dashboard platform designed to get recurring reports built fast.
White labelling: Yes, on eligible plans.
Entry price: $44 per month when paid annually, or $54 monthly, for three dashboards.
Entry limits: The individual plan currently includes 15 data sources. DashThis introduced source limits alongside its dashboard limits during 2026.
The limitation: There is no public API. That may not matter for a small agency that wants simple automated reports, but it becomes more restrictive for teams that eventually want to build their own reporting infrastructure around the data.
Whatagraph
What it is: A cross-channel marketing reporting platform aimed largely at agencies and teams producing polished multi-source reports.
White labelling: Yes, on higher tiers.
Entry price: Approximately $812 per month Max tier. More advanced functionality is gated behind Prime tier.
Entry limits: Pricing and feature availability vary by tier, with more advanced functionality gated behind higher plans.
The limitation: Whatagraph can deliver polished reporting quickly, but the pricing opacity makes modeling future costs more of a challenge. Get a current quote against your actual source and reporting requirements before shortlisting this platform.
Swydo
What it is: A client reporting platform with unlimited clients, users, dashboards and reports, priced around connected data sources.
White labelling: Yes.
Entry price: $69 per month, including the first ten data sources. Annual billing currently reduces that to roughly $62 per month.
Entry limits: After the first ten sources, additional sources are charged on a sliding scale.
The limitation: Source-based pricing is attractive when client count is high but can move in the opposite direction when every client has several accounts and platforms attached. Count sources rather than clients before comparing it with an agency platform.
Klipfolio
What it is: A highly customisable business intelligence and dashboard platform for teams that want considerably more control over metrics and presentation.
White labelling: Available.
Entry price: Klipfolio’s pricing varies by product and configuration, with current third-party and vendor material showing paid PowerMetrics options rather than one simple SEO-reporting entry price.
Entry limits: The real constraint is less about a fixed number of SEO reports and more about the product and configuration you choose.
The limitation: Flexibility comes with a steeper technical burden. Klipfolio makes more sense for teams willing to invest in custom metric modelling than for an agency whose priority is getting a standard monthly SEO report out quickly.
ReportGarden
What it is: An agency-oriented reporting platform built around recurring client reporting and workflow.
White labelling: Yes.
Entry price: Vendor-gated. Request a current quote.
Entry limits: Because public pricing is not sufficiently transparent, the cost of scaling across clients has to be established directly with the vendor.
The limitation: That makes ReportGarden harder to evaluate from the outside than products with transparent per-client, dashboard or source pricing. It is most relevant to agencies that already like its workflow enough to justify going through the sales process before they can model the cost.
Connectors, Suite Modules and the Free Source
The next six entries make the scope distinction from Section 1 even more important. Three primarily move data, two are reporting modules within much larger SEO platforms, and one is the free Google source sitting underneath a huge amount of SEO reporting.
Windsor.ai
What it is: A data connector that moves information from marketing platforms into destinations like Data Studio, Power BI, Google Sheets and data warehouses.
Entry price: $19 per month when billed annually, or $23 monthly, with three data sources and access to 350+ available sources.
Entry limits: Basic currently includes 75 accounts, unlimited BI syncs and five destination tasks.
The limitation: Windsor.ai is a pipe, not the finished report. You still need a builder at the other end.
Disclosure: This is the one product on this list that Veza uses directly. We use Windsor.ai daily to pull Search Console and GA4 data across six brand properties.
One important update from older pricing comparisons: Windsor.ai removed monthly active row limits and overage billing in July 2026. Data volume is now unlimited across its plans.
Supermetrics
What it is: A connector for extracting marketing data into destinations including Google Sheets, Data Studio, Excel, Power BI and data warehouses.
Entry price: Core options for Google Sheets and Data Studio currently start at €29 per month when billed annually.
Entry limits: The eventual cost depends on the package, number of data sources, accounts, and users required.
The limitation: Supermetrics becomes a configuration decision quickly. The entry price is useful for a small extraction workflow, but teams with multiple sources need to model the complete setup instead of assuming the starter figure represents their final cost.
Funnel.io
What it is: A managed marketing data hub for collecting, transforming and distributing data before it reaches the reporting layer.
Entry price: Funnel now uses a flexpoint model, with all paid configurations requiring a minimum allocation of 400 flexpoints. Current dollar pricing should be confirmed against Funnel’s live commercial quote before publication.
Entry limits: Connectors, platform accounts and destinations consume different numbers of flexpoints, so usage rather than a simple connector count determines cost.
The limitation: Funnel is substantial infrastructure for a team that simply wants prettier SEO reports. Its model makes considerably more sense when the problem is enterprise-scale data harmonisation.
The old free-plan comparison is also obsolete. Funnel closed that plan to new customers in December 2025.
Semrush My Reports
What it is: The reporting module inside the wider Semrush ecosystem, rather than a reason to buy the entire research platform solely for reporting.
White labelling: Available with Pro reports.
Entry price: Base reports cost $10 per report per month and Pro reports cost $20. Paid Semrush toolkits also include a number of Base reports.
Entry limits: Pro is required for full external integrations, hourly scheduling, custom branding and white labelling.
The limitation: The reporting price looks inexpensive in isolation, but the economics make the most sense when your team already uses Semrush. Buying a broad SEO research ecosystem purely to access its reporting layer is typically the expensive route.
SE Ranking Report Builder
What it is: The reporting functionality within SE Ranking’s broader SEO and GEO platform.
White labelling: Available through the Agency Pack.
Entry price: Core currently costs $129 per month on monthly billing, or $103.20 per month with annual billing. The Agency Pack adds $69 per month and is annual-billing only.
Entry limits: Core includes ten Report Builder reports. The Agency Pack adds white-label reporting and unlimited scheduled reports.
The limitation: Like Semrush, this is most compelling when you want the surrounding platform as well. If reporting is the only problem you are trying to solve, you are paying for considerably more product than a dedicated report builder provides.
Google Search Console
What it is: The free first-party Google search-performance source that feeds many of the reporting products above.
White labelling: No.
Entry price: Free
Entry limits: Search Console is a data source rather than a polished client or executive reporting environment.
The limitation: It tells you what is happening in Google Search, but it is not designed to combine your SEO data with broader marketing and business outcomes in one finished report.
That distinction becomes even more important in 2026 because Search Console now contains generative AI performance reporting that external reporting tools cannot currently pull automatically.
Agency or In-House
The best SEO reporting tools depend heavily on who will be reading the report.
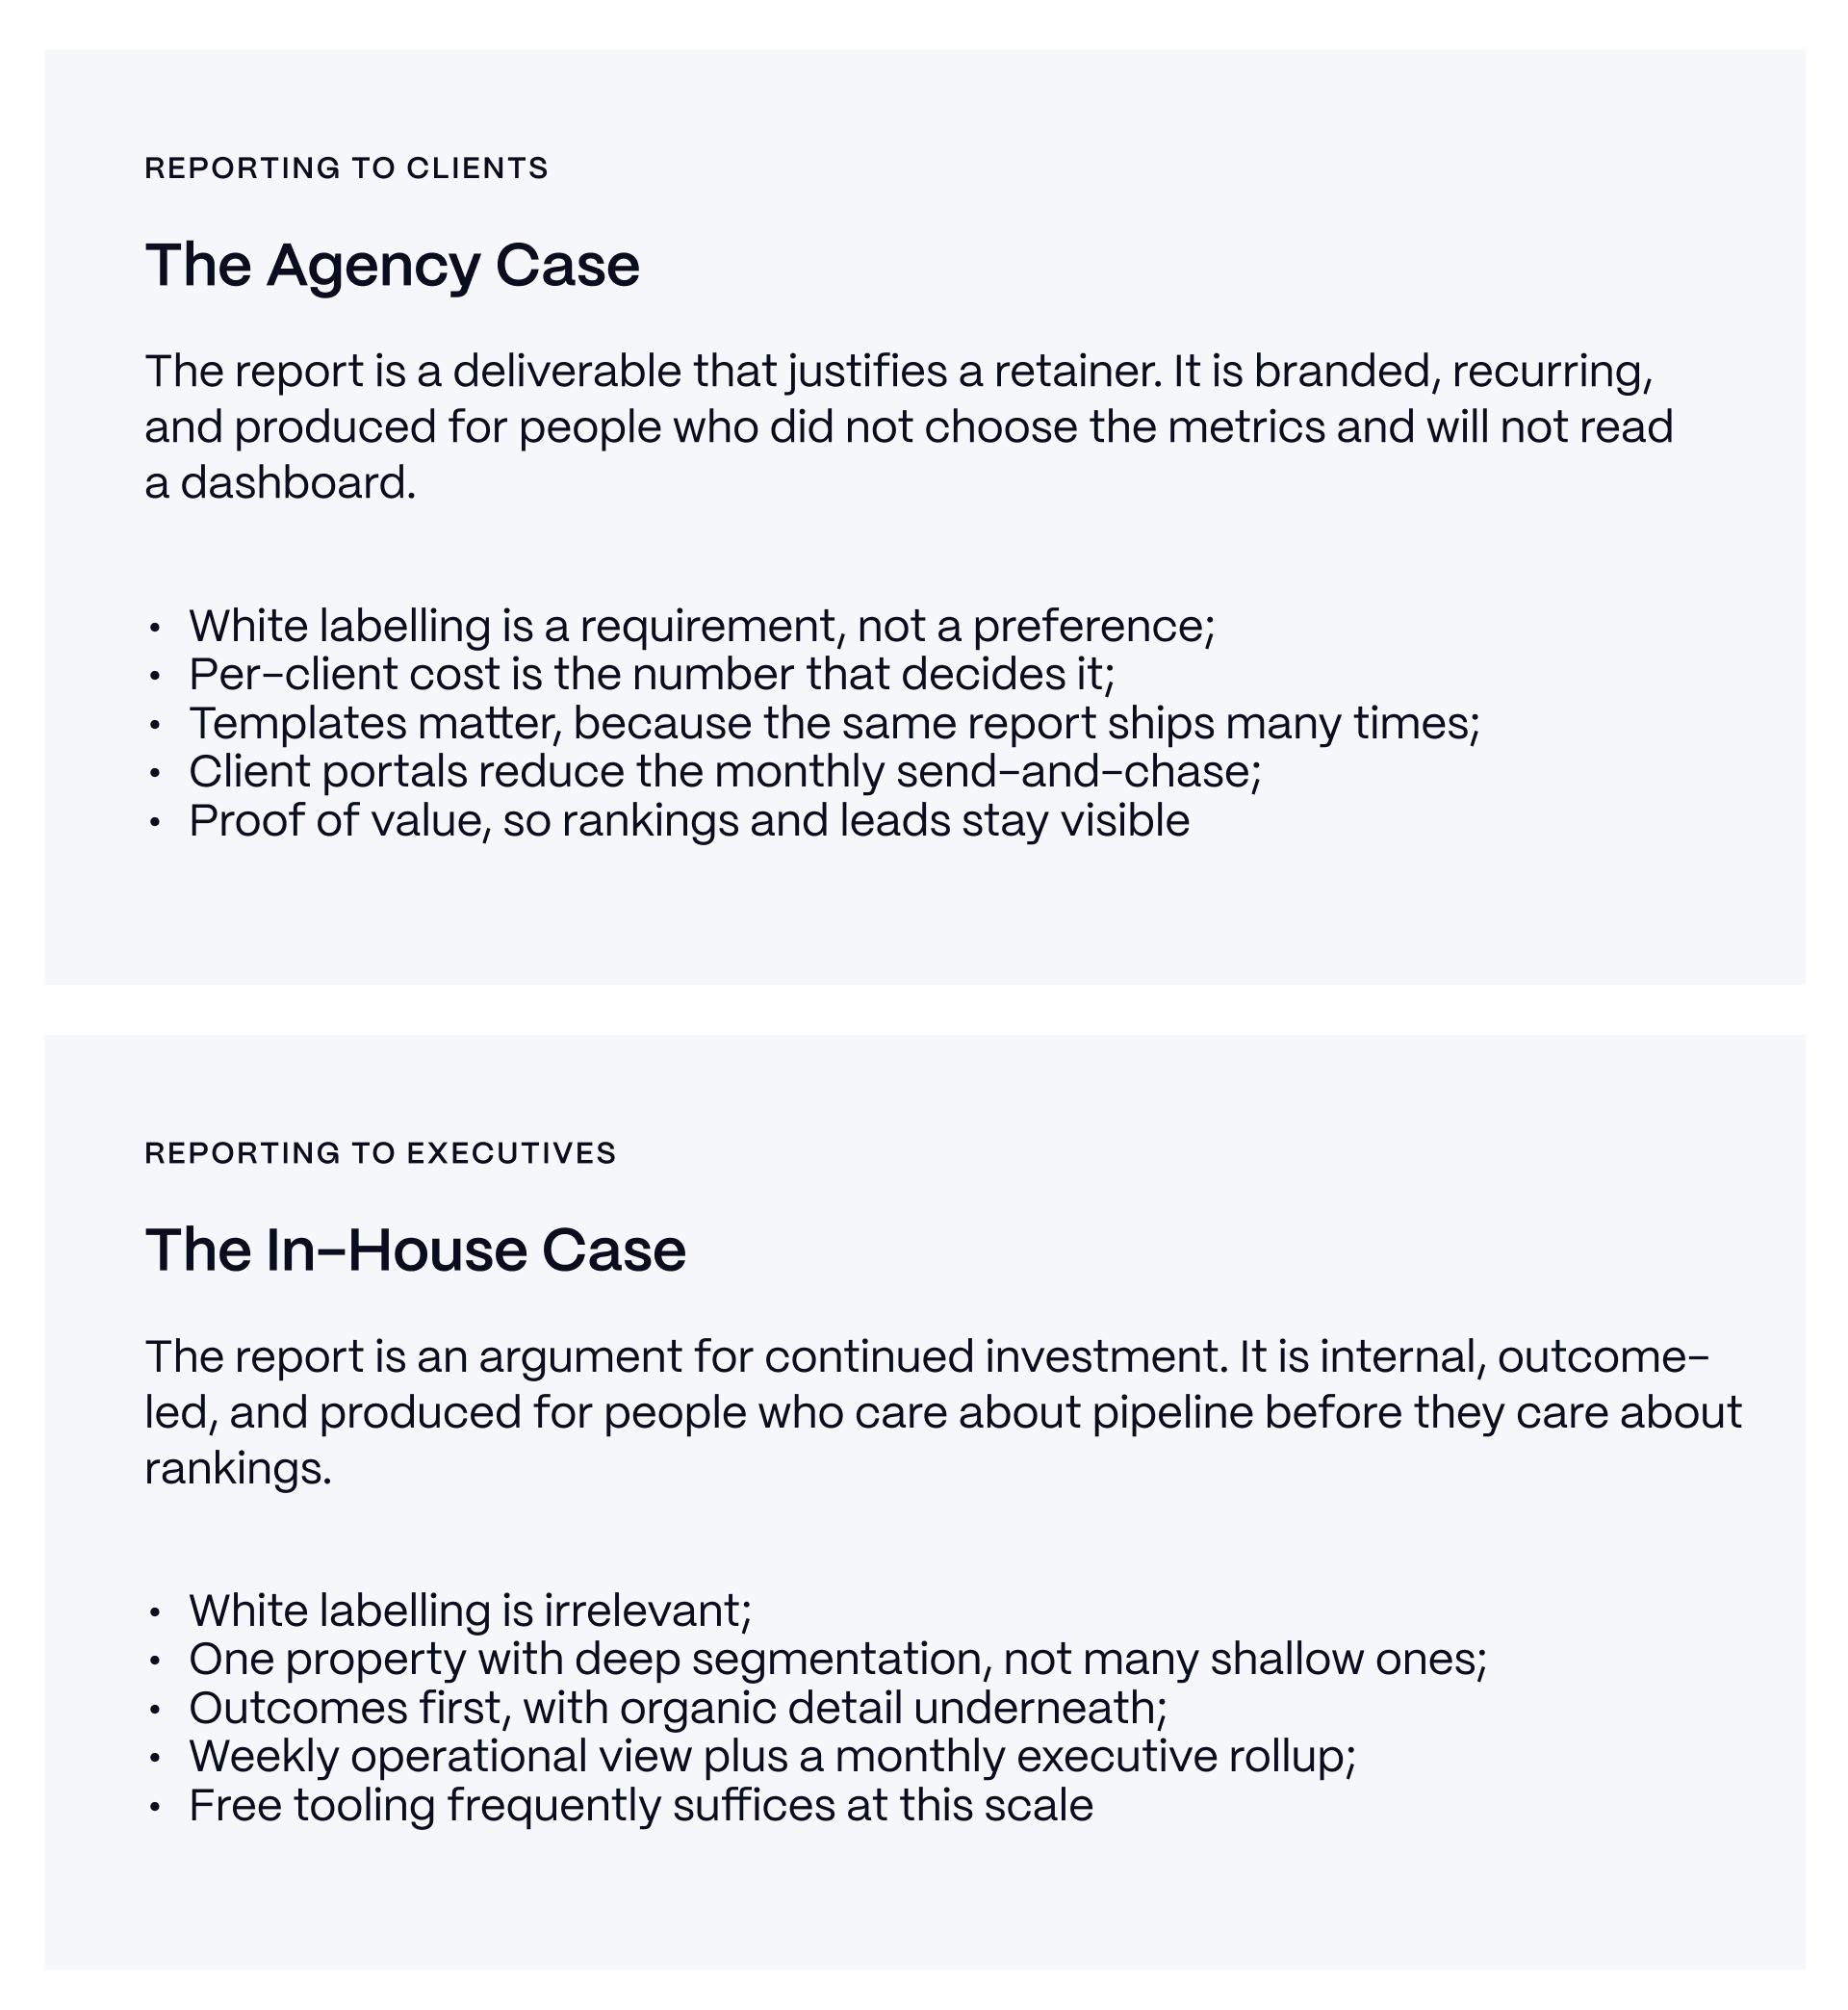
An agency sends reports to clients who are paying for a service and want to see what that investment was able to produce. An in-house SEO team reports to executives deciding where the next quarter’s budget should go. The underlying SEO data might be similar, but the job of the report differs.
This changes which features matter and how much they’re worth paying for.
Two Different Products
For an agency, the report is part of the deliverable.
Clients may never log into Search Console, GA4 or the SEO platforms producing the underlying data. The report is where the majority of that work becomes visible, which means that presentation matters. White labelling makes the report feel like part of the agency's service rather than a collection of third-party dashboards. Templates matter because the same reporting process needs to run across multiple accounts every month without rebuilding it from scratch.
That makes per-client cost one of the most important numbers for an agency. A platform that looks inexpensive for five clients can become a significant operating expense at 20 or 40.
For an in-house team, the report has a different job. It needs to make the case for continued investment.
Executives are less interested in whether the dashboard carries your logo than whether organic search is generating pipeline, signups or revenue. Rankings and traffic still matter, but primarily as evidence explaining the business outcome.
This makes expensive agency features much easier to cut. If Search Console, GA4 and Data Studio can answer the questions leadership is asking, a free or low-cost reporting stack might be all you need.
What Each Audience Actually Wants
Agency clients typically need proof that their retainer is producing something worthwhile. This means it needs to provide a combination of rankings, organic traffic, leads, and conversions, with AI visibility increasingly entering the conversation.
The reporting challenge comes with context. It’s all well and good increasing rankings, but if qualified leads fall at the same time, it’s a little redundant. Traffic growth looks less impressive if none of it reaches the page that is responsible for generating pipeline.
Executives usually want the hierarchy reversed.
Pipeline, signups, revenue contribution and customer acquisition cost belong near the top. Organic sessions, rankings, click-through rates and other SEO metrics sit underneath, which helps explain why those outcomes changed.
This is where broader B2B analytics tools become more relevant. SEO reporting rarely exists in isolation once the audience moves beyond the SEO team. Leadership wants to understand how search contributes to the wider acquisition picture.
The practical answer is often to build two boards rather than one.
An executive outcome board shows the small number of business metrics leadership needs to make decisions. A specialist diagnostic board gives SEO and marketing teams the rankings, queries, landing pages, technical signals, and channel detail they need to understand what caused the outcomes.
Trying to make one dashboard serve both audiences will typically wind up pleasing neither, with a report that’s too deep for executives, yet too shallow for specialists.
Marketing attribution tools belong in that executive layer as well, especially when the question shifts from how organic search performed to how much credit it should receive for pipeline and revenue.
The Cost Consequence
For agencies, the safest way to compare reporting software is to model the cost at twice your current client count before you sign an actual contract.
If you have ten clients today, you should price the platform for 20. Per-client pricing tends to scale linearly, while per-dashboard plans can appear inexpensive until growth pushes you through a cap and into the next tier. The cheapest option at your current size might not always remain that way.
In-house teams should run almost the opposite test.
Ask which features you’re paying for that nobody in the business actually needs. White labelling is the clear and obvious example. If every person reading the report works for the same company, paying a premium to remove vendor branding rarely improves the decision that is being made.
Begin with the reporting requirement, and then pay for the features that solve it.
For a lot of internal teams, this makes the free stack decidedly harder to beat.
The AI Search Reporting Gap
Google finally gave website owners first-party data on their visibility inside AI search in 2026. It also created a reporting issue.
Search Console can now show when your pages appear in Google's gen AI features. However, the data available inside the interface and the data that reporting tools automatically extract are two different things.
If you plan to make AI visibility a core part of your monthly SEO reporting, this distinction is crucial.
What Google Shipped
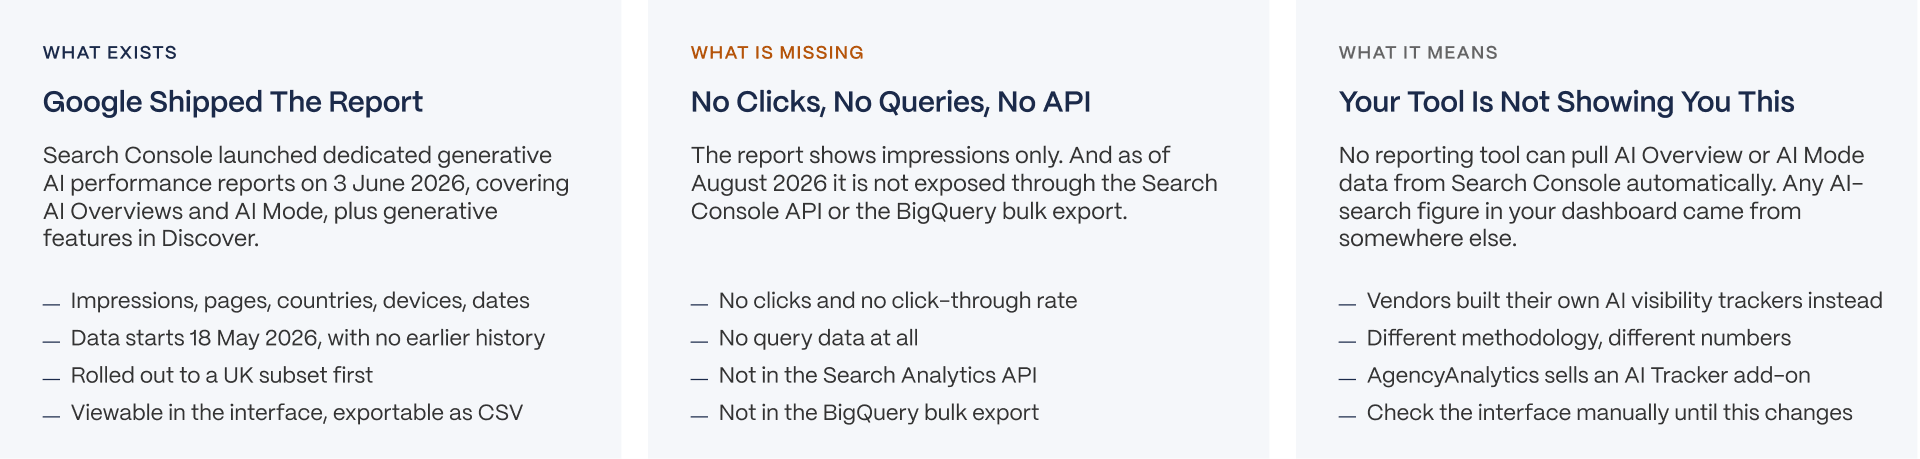
On June 3, 2026, Google launched dedicated generative AI performance reports in Search Console for Search and Discover.
The Search report covers appearances in AI Overviews and AI Mode, while a separate Discover report covers Google’s generative AI features. The report displays impressions along with the pages that receive them, countries, devices for Search, and dates.
This gives SEO teams something they previously lacked: a first-party view of which pages are actually appearing within Google’s generative search experiences.
There are limits to the history. Data begins on May 18, 2026, with no earlier history available. This means there’s no year-over-year baseline or pre-AI comparison sitting inside the report.
The rollout has also changed since launch. Google initially released the reports to a subset of websites, starting with UK properties, before expanding access. On August 31, Google confirmed that the insights had expanded to websites globally.
The key term in all of this is impressions.
The report tells you how often your pages appeared, but not how much traffic was produced as a result. If you distinguish impressions versus clicks in conventional SEO reporting, this is a distinction that becomes hugely important.
What is Missing?
The new report is a visibility report, but doesn’t assess complete performance.
Click-through rates and query-level data are not included. You can see that a page appeared in Google’s generative AI features, but you can’t see the search that triggered the appearance. This is another limitation that matters for this article.
As of August 2026, the dedicated generative AI performance data was not available through the Search Analytics API or Search Console’s BigQuery bulk export. Google has not published API access for it, but it has not ruled out adding access later.
So the wording matters: not available via the API as of August 2026.
The practical consequence here is bigger than it sounds. A reporting platform can connect to Search Console and automatically pull conventional search data, but it can’t currently use that connection to pull the dedicated AI Overview or AI Mode performance data automatically.
That means a polished SEO dashboard can contain less first-party Google AI data than the Search Console interface sitting underneath it.
Until such a time as Google exposes that data programmatically, the gap remains.
So Where Do Your AI Numbers Come From?
Reporting vendors did not wait for Google.
AgencyAnalytics, for example, offers an AI Tracker add-on that monitors visibility, sentiment, position, and citations across ChatGPT, Google AI Overviews, AI Mode, Claude and other AI engines. It currently costs $20.83 per month for 250 credits when billed annually (VERIFY).
SE Ranking also tracks AI visibility across five engines: ChatGPT, Gemini, Perplexity, Google AI Overviews, and AI Mode.
These are legitimate products measuring real signals. However, their numbers come from the vendors’ own tracking systems and methodologies. They aren’t the dedicated generative AI performance data shown inside Search Console.
This is a distinction that needs to survive into the client report.
If you use third-party AI visibility data, make sure you label it as vendor data as opposed to presenting it as Google Search Console performance. Then manually check Search Console for first-party impression data until access changes.
For deeper AI-specific measurement, use dedicated AI Overview monitoring tools and LLM optimisation tools rather than expecting conventional reporting platforms to solve the issues.
And if the question is broader than reporting, an AI search visibility audit can establish where your brand is appearing. It can also help gauge where your competitors are winning, and what changes you need to make.
What It Costs
SEO reporting tool costs don’t really tell you anything until you know what you’re being charged for.
You can have two products with similar entry prices that wind up producing very different bills. The important number to look out for is the configuration cost, as opposed to the cheapest price that’s displayed.
Five Pricing Models, Not Five Prices
SEO reporting tools charge for different things.
AgencyAnalytics prices around the number of clients. DashThis limits plans by dashboard and data sources. Databox and Swydo make the number of connected data sources a crucial part of the cost. Whatagraph uses source credits, and Funnel.io uses its own flexpoint system.
Windsor.ai is structured around the number of accounts available at each tier. One major difference from older comparisons is that monthly active row limits don’t belong in the calculation. Windsor.ai removed those limits in July 2026, and this makes simple price comparison misleading.
An agency with 30 clients but relatively simple reporting requirements might prefer a product that doesn’t charge per client. Businesses with one executive dashboard but dozens of connected marketing sources might reach its limit faster. A Funnel.io customer needs to translate infrastructure into flexpoint consumption before considering headline cost.
Before you compare prices, write down three core stats:
- How many clients do you have to report on?
- How many dashboards or reports do you need?
- How many data sources and accounts need to be connected?
After this you need to price every shortlisted product against the same configuration, and this will tell you much more than simply putting seven entry prices in order.
The Two Stale Figures
Two pricing claims need caution because they appear in older comparisons.
AgencyAnalytics moved to flat per-client pricing in May 2026. Older Freelancer plans at $59 to $79 and Agency plans at $179 to $229 do not represent the current pricing structure. The entry model is now $20 per client per month, when billed annually.
Funnel.io has fundamentally changed as well, with the free plan now closed to new customers, as of December 2025. Instead, current pricing uses flexpoints, with paid configurations needing at least 400 flexpoints.
Check the date on the pricing source before committing to a figure.
The Selection Checklist
Price is only useful at the moment that you understand what your reporting operation actually needs.
The following checklist turns that need into 10 questions you can ask against every shortlisted product.
Pay close attention to items one, two, and six. These are the areas in which reporting tools that appear inexpensive can become more expensive the second real client and data requirements are applied.
Make sure you don’t skip item 10: try the free stack first.
Search Console, GA4, and Data Studio can cover a huge amount of SEO reporting without the need for an additional paid subscription. If they are already providing answers to questions your team needs, it’s tough to justify adding additional reporting software.
This is an option you should test before you pay anyone.
Choosing
At this point in the process, the shortlist should be considerably smaller.
By this stage, you know whether you need a report builder or a connector, which pricing model is right for your setup, and why AI visibility should be treated separately. Making the final decision here rests on the shape your reporting operation is in.
Decision by Situation
There’s no single standout choice when it comes to SEO reporting tools, because the situation will impact the buying decision.
If you’re in-house and have no reporting budget, start with Search Console, GA4 and Data Studio. These will allow you to build a capable reporting stack without having to manage another subscription, especially if the audience is internal.
Alternatively, if you’re in-house with multiple sources but very little time, dashboard platforms like Databox can reduce the work of combining business and marketing metrics.
If you’re an agency with fewer than ten clients, you should look to prioritise speed. When templates and automation are used to reduce time spent on client reports, DashThis, Swydo, and AgencyAnalytics become much easier to justify.
Agencies scaling beyond 15 clients should model their cost at the next stage. It’s important to recognize that the platform that functioned well with eight clients can become expensive at 20, especially as pricing scales directly with the client roster. For the B2B companies we work with, this matters, as complexity grows alongside the wider market operation.
If nothing is connected, you won’t benefit from an additional dashboard. Build the pipeline first with a connector such as Windsor.ai, Supermetrics or Funnel.io, then make the decision about how you want to present the data.
Across every situation, ask the essential question: where will your AI visibility data come from? Your conventional SEO reporting stack can’t currently automate the dedicated generative AI data that lives inside Search Console
The same principle applies elsewhere. If the underlying issue is a technical SEO performance problem, conducting a technical SEO audit matters more than another dashboard.
DECISION BY SITUATION
Veza sells no reporting tool. We use one, Windsor.ai, daily across six brand properties, and that is disclosed above. What follows is shortlist logic from published information plus the checklist, not a tested ranking.
SITUATION 1: IN-HOUSE, ONE PROPERTY, NO BUDGET
- Profile: a marketing team reporting to executives on one website
- What to use: Search Console plus GA4 plus Data Studio
- Why: this stack costs nothing, connects natively to the Google sources you already care about, and covers more than most teams expect. The cost is setup time and maintenance, not licence fees. White labelling, which is the main reason to pay in this category, is irrelevant when the audience is your own board.
The verdict: exhaust the free stack before buying. If it fails, you will know exactly what you are paying to fix.
SITUATION 2: IN-HOUSE, MULTIPLE SOURCES, LIMITED TIME
- Profile: the data exists across ad platforms, GA4 and Search Console, and nobody has time to maintain dashboards
- What to look at: an executive dashboard tool with strong templates
- Why: the constraint here is maintenance, not capability. Databox ships 300-plus templates and is built for executive-facing reporting rather than client delivery, which matches the audience. The trade-off is per-source cost, so count your sources first.
The verdict: pay for templates and maintenance, not for white labelling you will never use.
SITUATION 3: AGENCY, UNDER TEN CLIENTS
- Profile: white-label client reporting on a recurring cycle
- What to look at: per-client or per-dashboard platforms
- Why: this is the segment the category was built for. AgencyAnalytics prices per client at $20 a month annually with white labelling included, DashThis prices per dashboard from $54, and Swydo starts around $49 including ten data sources. All three ship templates, scheduling and client access.
The verdict: model per-client cost at double your current client count, then pick on pricing model rather than on feature lists.
SITUATION 4: AGENCY, SCALING PAST FIFTEEN CLIENTS
- Profile: reporting cost is becoming a line item worth managing
- What matters: the pricing model, not the entry price
- Why: per-client pricing scales linearly and becomes the largest reporting cost at volume. Per-dashboard pricing hits caps that force upgrades. Source-credit models surprise people. At this size the correct answer is frequently a pipeline plus a report builder rather than an all-in-one, because the cost curve is flatter.
The verdict: recalculate at your projected client count before renewing anything annual.
SITUATION 5: THE PROBLEM IS THAT NOTHING IS CONNECTED
- Profile: the data exists but lives in separate platforms and nobody can join it
- What to look at: connectors and pipelines, not report builders
- Why: buying a dashboard tool to solve a plumbing problem produces an empty dashboard. Windsor.ai starts at $19 a month for three sources with all connectors and destinations included, Supermetrics is strongest for Sheets and Data Studio extraction, and Funnel.io is the enterprise option at $400 a month and up.
- Disclosure: Windsor.ai is the tool we use. We use it because the pricing includes every connector rather than gating premium ones, and because it pulls Search Console and GA4 reliably across six properties. It is a pipe, not a reporting tool, and we pair it with a report builder.
The verdict: diagnose which layer is broken before shopping. The wrong layer is an expensive way to stay stuck.
CROSS-SITUATION: THE AI SEARCH QUESTION
- Profile: anyone being asked about AI visibility in a report
- What to know: Search Console's generative AI report exists but is not in the API as of August 2026
- Why: no reporting tool can pull AI Overview or AI Mode data from Search Console automatically. Any AI number in your dashboard comes from the vendor's own tracker, measured differently. That is not disqualifying, but it should be labelled in the report rather than presented as Search Console data.
The verdict: check the Search Console interface manually, and label vendor AI metrics as vendor metrics.
PRINCIPLE
Reporting tools do not generate insight, they reduce the cost of producing a report. That is a real and worthwhile saving, and it is a smaller claim than most of this category makes. The correct tool is the one whose pricing model matches the shape of your work: per client if you serve clients, per source if you have many sources, free if your audience is internal and your patience is longer than your budget.
What To Do This Week
You can test most of this before you sign a contract.
Be sure to write down your current client count, dashboard count, and data-source count. Then time how long your monthly SEO report takes to produce, from the start of gathering data until the moment someone receives it.
Next, check every AI visibility metric you currently report. Is it coming from Google Search Console or a third-party vendor tracker? Keep a record of where it’s from.
Finally, connect Search Console and GA4 to Data Studio and build the simplest report that your audience is able to use. See how far the stack gets you, and then you’re in a position to pay to remove any remaining friction.
The Honest Limit
Reporting software won’t generate insights, but it does reduce cost and time needed to produce a report. This saving is bona fide and worthwhile, and a smaller claim than much of this category makes.
Choosing the right pricing model means selecting one that best matches the shape of your work. This means per client if you serve clients, per source if reporting spans multiple sources, and free if your audience is internal and your patience is longer than your budget.
A better report is not the same as a better number.
Reporting tools reduce the cost of producing a report, which is a real saving and a smaller claim than most of this category makes. What they cannot do is improve the thing being reported on, and they cannot show you Search Console's AI Overview data because Google has not put it in the API yet. We work with B2B SaaS teams on the layer underneath the dashboard: whether the measurement is trustworthy, what the numbers are actually saying, and what to change as a result. If your reporting is fine and the results are not, that is the conversation worth having.
FAQs
What is the best SEO reporting tool?
It depends on whether you report to clients or to executives, which changes the answer completely. Agencies need white labelling and should decide on per-client cost. In-house teams rarely need white labelling and can frequently get further than expected with Search Console, GA4 and Data Studio, which cost nothing.
How much do SEO reporting tools cost?
From free to several hundred a month, but the entry price is the least useful number. The models differ in kind: AgencyAnalytics charges per client at twenty dollars a month, DashThis per dashboard from fifty-four, Databox and Swydo per data source, and Funnel.io on flexpoints from four hundred.
Are Ahrefs and Semrush SEO reporting tools?
Not primarily. They are research platforms that include reporting modules. Semrush prices My Reports separately at ten to twenty dollars per report on top of a plan from a hundred and forty. Buying a research suite for its reporting is usually the expensive route, and we cover those tools separately.
What is the best free SEO reporting tool?
Search Console plus GA4 plus Data Studio, which is free and covers more than most teams expect. Data Studio was renamed back from Looker Studio in April 2026. The cost is setup time and maintenance rather than licence fees, and the main limitation is no white labelling.
Can reporting tools show AI Overview data?
Not from Search Console. Google launched generative AI performance reports on 3 June 2026, but the data is not exposed through the API or BigQuery export as of August 2026. Any AI number in your dashboard comes from the vendor's own tracker, measured differently, and should be labelled that way.
What does Search Console's AI report actually show?
Impressions for AI Overviews and AI Mode, broken down by page, country, device and date. No clicks, no click-through rate and no queries. Data starts 18 May 2026 with no earlier history, and rollout began with a UK subset, so check whether your property has it.
Do I need white labelling?
Agencies almost always do, because the report is a client-facing deliverable. In-house teams almost never do, and paying for it is the most common overspend for internal teams in this category. If the audience is your own executives, the branding on the report is already yours.
What is the difference between a reporting tool and a data connector?
A connector moves data between systems and assigns no meaning. A reporting tool arranges data into something a person reads. Windsor.ai, Supermetrics and Funnel.io are connectors. Buying one expecting a dashboard produces an empty dashboard, which is the most common mistake in this category.
How many tools do I actually need?
Frequently two, a connector and a builder, rather than one all-in-one. At small scale an all-in-one is simpler and cheaper. Past roughly fifteen clients, per-client pricing makes the pipeline-plus-builder route cheaper, because the cost curve is flatter.
Has Veza tested these tools?
One of the fourteen. We use Windsor.ai daily to pull Search Console and GA4 across six brand properties. Everything else here comes from vendor documentation and dated third-party sources, marked as such in the comparison table. We sell no reporting tool.
