.jpg)
Abstract
There is no single best AI analytics tool for B2B SaaS. There is a stack. Many teams buy one platform expecting it to answer every question, then discover it cannot tell them which campaigns drive the pipeline, how users behave in the product, which accounts are in-market, and where visitors drop off.
These are five different categories of analytics: marketing attribution, product analytics, business intelligence, account intelligence, and conversion analytics. Treating them as a single problem can lead to issues including fragmented data, misleading reports, and wasted spend.
This guide breaks down the best AI analytics tools for B2B SaaS in 2026, organized by category. We distinguish between AI-native tools (built around LLMs and predictive models from day one) and AI-sprinkled tools (legacy platforms with AI features layered on top).
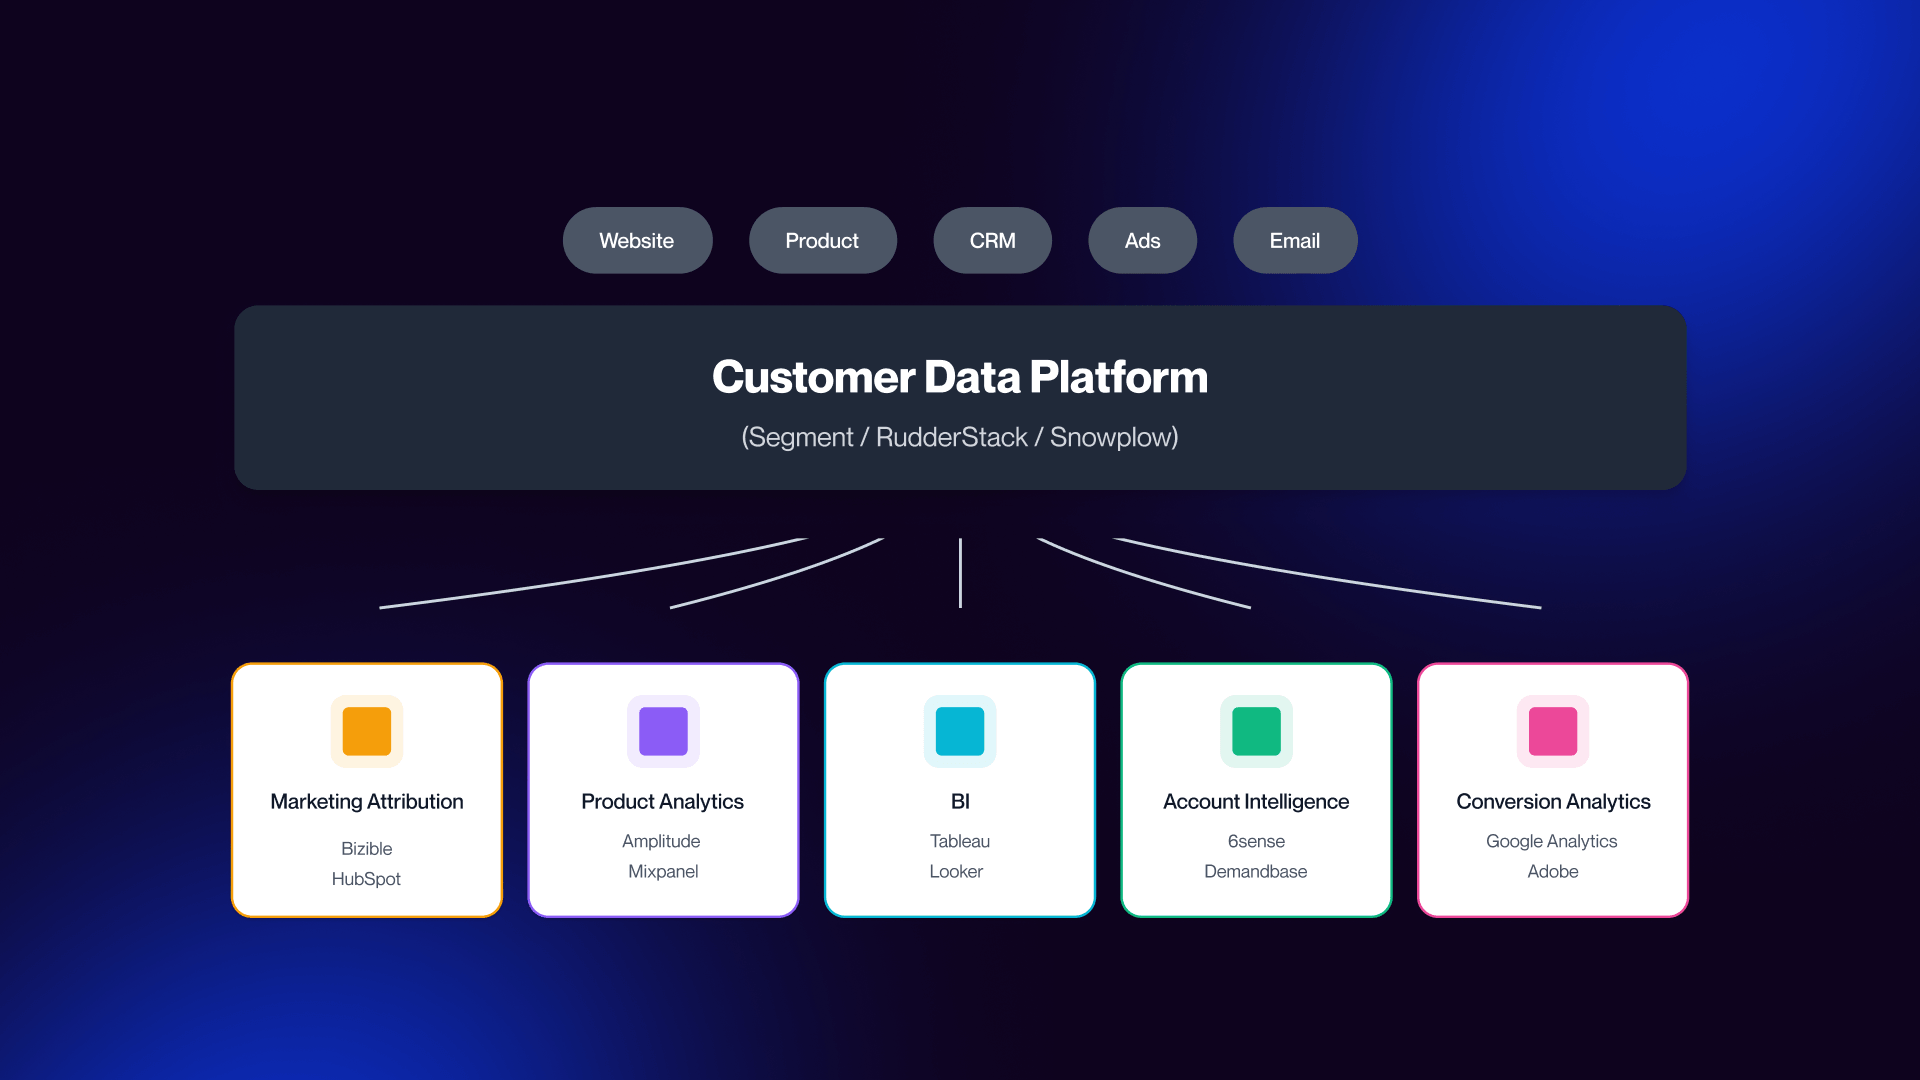
The 5 Categories of B2B Analytics (and What AI-Native Actually Means
Not all AI analytics tools solve the same problem, and being able to understand the five core categories is the difference between a coherent stack and fragmented reporting.
Why “AI Analytics” Means 5 Different Things
“AI analytics” has become a catch-all term in modern times, and refers to anything from text-to-SQL BI tools to predictive lead scoring, in-app behavior tracking, or AI-generated dashboards.
The reality is that B2B analytics is not a singular category, but instead serves as five distinct systems, each one answering a unique question. Marketing attribution asks which campaigns drive pipeline and revenue. Product analytics shows how users behave inside the product. Business intelligence reveals how the business performs, while account intelligence allows teams to identify the accounts that are in-market right now. Finally, conversion analytics reveals where visitors drop off on high-intent pages and signup flows.
Product analytics tools won’t tell you which ad campaign influenced a particular deal. A BI layer doesn’t explain where onboarding friction appears in the product. An attribution platform cannot show you why users might choose to abandon a pricing page CTA.
There’s also a foundational layer that a lot of teams tend to overlook, and this is the customer data platform. A CDP such as Segment or RudderStack works to standardize event data before it reaches the analytics layer. Without that shared foundation, every tool in the stack develops its own definitions, and the numbers stop matching across teams.
AI-Native vs AI-Sprinkled: How to Tell the Difference
In 2026, every analytics platform makes the claim of AI. According to McKinsey, around 88% of businesses last year reported using AI in at least one business function. But the true question surrounds not whether AI actually appears in the interface, but rather whether AI makes a meaningful change to the workflow.
Note: Both categories are valid. The distinction matters for workflow, pricing, and long-term scalability.
AI-native tools are built around LLMs and predictive models from the ground up. They’re designed so that users can start with questions right away. Instead of building reports manually and layering on top, these tools help to generate queries, surface patterns, explain anomalies, and shorten the gap between questions and answers.
This is why tools like June.so, Powerdrill Bloom, Hex Magic, Tableau Pulse, Amazon Q in QuickSight, and Equals AI have a different feel to them than older analytics platforms. Here, the AI is no longer a side feature, but an integral part of the product’s functionality.
AI-sprinkled tools behave differently. Platforms such as HubSpot Breeze, GA4 Insights, Mixpanel AI, and Amplitude AI add assistants, summaries, or recommendations onto workflows that were originally built around dashboards, filters, and manual analysis. This does not make them bad tools, and in many cases they’re still the best fit for teams seeking familiarity and stability. For broader context on where these platforms sit within the wider GTM landscape, see Veza’s guide to AI tools for B2B marketing decisions.
The Cost of Stack Fragmentation
A single platform like HubSpot can cover CRM, marketing automation, and basic attribution inside one ecosystem. This simplicity is attractive, particularly when it comes to smaller teams, and the trade-off here is depth. It can handle several jobs adequately, but this typically does not outperform specialists inside each category.
A specialist stack is more powerful, but also more demanding. A B2B SaaS company might combine Dreamdata for attribution, Mixpanel for product analytics, Tableau for BI, 6sense for account intelligence, and Hotjar for conversion analytics. That setup covers the full buyer and user journey far better than a single all-in-one tool, but it also brings in more cost, implementation work, and more chances for reporting friction.
This is why the CDP matters so much. It gives every specialist tool the same event data and the same underlying source of truth. Without it, each platform starts interpreting users, sessions, touchpoints, and conversions differently. Marketing sees one version of the pipeline, while sales sees another, and the product sees a third.
The solution here is not necessarily fewer tools but a stack designed intentionally, with shared data definitions underneath it. The best analytics setup is rarely a single product, but rather a combination of tools that match your stage, motion, and the questions your team needs answered.
Marketing Attribution Tools: Which Campaigns Actually Drive Revenue?
Marketing attribution tools answer the most important questions in B2B growth, such as which channels and campaigns generate pipeline and revenue.
What Marketing Attribution Tools Do
On the surface, attribution is a simple concept: connect marketing spend to revenue. However, in practice, it’s a very difficult problem to solve in B2B analytics because it presents such a fragmented customer journey. Sales cycles frequently stretch from 6 to 18 months, with dozens of touchpoints across ads, content, email, product interactions, and sales conversations.
The first issue is a tracking problem. Privacy changes, especially when it comes to iOS and browser restrictions, ensure that client-side tracking (pixels, cookies) misses a significant portion of user activity. Attribution platforms solve this with server-side tracking, stitching together sessions, identities, and events more reliably across devices and channels.
Second is the attribution model problem. A typical B2B deal tends to be influenced by multiple interactions over time. A prospect might discover your brand through content, paid ads, webinars, or engaging with sales, and might only convert months later. Assigning 100% of the credit to either the first or last touchpoint distorts reality.
Without attribution, marketing teams are effectively guessing:
- Which campaigns actually drive pipeline?
- Which channels deserve more budget?
- Which activities look good in dashboards but don’t convert?
When you have attribution in place, those are decisions that become grounded in revenue. Campaigns are able to scale or be cut based on actual contributions to pipeline and closed deals, as opposed to vanity metrics.
Best Marketing Attribution Tools for B2B SaaS
Below are the leading attribution platforms for B2B SaaS:
Dreamdata
The closest thing to a B2B-native attribution standard today is Dreamdata. It maps out the full customer journey from first touch through to closed revenue, with strong CRM integrations, including HubSpot and Salesforce.
Dreamdata also layers in AI signals to identify intent and optimize campaign targeting.
Dreamdata reports that 81% of the B2B customer journey happens before a sales conversation begins, which reinforces why attribution needs to capture activity long before filling out a form.
Best for: Mid-market to enterprise B2B SaaS teams with an already established CRM and multi-channel GTM motion.
Pricing: Start tier is free, Advanced tier has custom pricing.
HockeyStack
HockeyStack differentiates itself through revenue agents, i.e. AI-driven workflows that don’t simply report on performance, but instead suggest actions. It also emphasizes unifying data across marketing, sales, and product into a single model.
Best for: Growth-stage B2B SaaS teams that seek attribution and actionable insights, while avoiding enterprise complexity.
Pricing: For pricing details, sign up at HockeyStack.com/pricing.
Factors.ai
Instead of simply tracking channels, Factors.ai focuses on account-level journeys, combining behavioral signals, campaign data, CRM activity, and intent signals into a unified view. Its AI agents go beyond reporting to execution, which automatically triggers campaigns, updates audiences, and prioritizes accounts.
Vendor-reported case studies suggest measurable gains such as improved pipeline influence and conversion efficiency, though these should be treated more as directional rather than universal benchmarks.
Best for: ABM-heavy B2B SaaS teams that are focused on account-level orchestration.
Pricing: For pricing details, sign up at Factors.ai/pricing.
HubSpot Marketing Hub
HubSpot offers built-in attribution alongside CRM, marketing automation, and email, making it attractive for its simplicity. Breeze AI adds automation and recommendations on top of existing workflows, but the core attribution model is still less sophisticated than specialist tools.
Marketing Hub Professional starts at ~$800/month (billed annually)
Best for: Teams seeking ease of use and consolidation as opposed to depth.
Cometly
Cometly performs at the optimal level for paid acquisition-heavy teams, especially those running multi-channel ad campaigns where tracking accuracy is important. However, its visibility in the market is amplified by strong content marketing, and it should be evaluated alongside more established B2B attribution platforms.
Best for: Paid-heavy B2B SaaS team focused on performance marketing.
Pricing: Custom, typically depends on ad spend.
Salesforce Marketing Cloud Intelligence
This offers deep customization, advanced reporting, and scalability, but comes with considerable implementation complexity and cost.
Best for: Enterprise organizations with dedicated marketing operations and data teams.
Pricing: Custom enterprise pricing.
The Multi-Touch vs First/Last Touch Debate
First-touch attribution gives full credit to the initial interaction. This tends to overweight channels such as SEO, content, and brand awareness. Last-touch attribution assigns all credit to the final interaction before conversion, which often inflates the impact of direct traffic and branded search.
Multi-touch attribution attempts to distribute credit across the full journey via algorithmic or rules-based models. In theory, this is the most accurate representation of how B2B buying actually operates.
Multi-touch models rely on enough historical data to help identify patterns across journeys. Smaller SaaS companies often lack sufficient deal volume to stabilize these models, which can lead to multi-touch creating a false sense of precision.
Earlier-stage companies require a more honest approach by comparing first-touch and last-touch side by side. The gap between them tends to reveal greater insight than a lot of premature multi-touch models.
Specific thresholds for when multi-touch becomes statistically reliable can vary widely, and need to be treated with caution.
Overbuilding too early creates noise and underinvesting too late leaves revenue on the table.
Product Analysis Tools: How Do Users Actually Behave?
Product analytics tools reveal what happens after the signup process, transforming user behavior into insights that drive retention, action, and expansion.
Why Product Analytics Is Different From Marketing Analytics
Marketing analytics ends at the signup form, while product analytics begins after it.
Marketing analytics tells you who converts, but product analytics tells you why they convert, what they do next, and whether they stay.
Inside B2B SaaS products, meaningful actions become an event:
- Feature usages
- Onboarding steps
- Activation milestones
- Retention and churn signals
- Cohort behavior over time
Instead of relying on MQLs, teams can start to identify PQLs based on real usage patterns.
It is commonly claimed that PQLs convert at a higher rate than MQLs, and this is because they have already experienced product value. While directionally true, the majority of published conversion lift figures come from vendors, and they can vary widely depending on product type and motion.
Growth evolves from “how do we acquire users?” to “how do we activate, retain, and expand them?”
That shift is what makes product analytics one of the most essential layers in a modern B2B analytics stack.
Best Product Analytics Tools for B2B SaaS
Below is a collection of some of the leading product analytics platforms, with AI-native tools prioritized where they meaningfully change how insights are generated.
June.so (AI-Native)
Instead of requiring teams to build dashboards manually, June.so automatically surfaces insights, highlights some of the key changes in user behavior, and allows exploration of natural-language. This removes a major bottleneck for PLG teams that don’t have dedicated analysts.
Best for: B2B SaaS teams running PLG motions that want fast, insight-driven workflows without the need for heavy setup.
Pricing: Free trial available; usage-based pricing dependent upon monthly active users. Verify on June.so.
Mixpanel
Mixpanel requires a defined event taxonomy, but in return provides deep visibility into user journeys. AI features added in recent years fall into the category of AI-sprinkled, as opposed to fundamentally changing the workflow.
Best for: Established SaaS teams with a clear analytics structure, along with internal data ownership.
Pricing: Free tier available, growth plans starting from $0 with 1M monthly free events. Custom enterprise-level plans available.
Amplitude
Amplitude is particularly strong at allowing teams to understand why users churn, expand, or convert, using cohort-based analysis and predictive signals. Much like Mixpanel, its AI capabilities are layered onto an existing analytics framework.
Best for: Mid-market PLG SaaS teams that want deeper behavioral insights and predictive modeling.
Pricing: Starts at around $49/month depending on your usage.
Heap
Instead of requiring teams to define events upfront, Heap records everything automatically, which allows teams to analyze user behavior retroactively. This gets rid of the need to “get tracking right” from day one.
The trade off here comes with data noise, but this flexibility is often worthwhile for early stage teams.
Best for: Early-stage SaaS teams that are still trying to figure out what matters in their product.
Pricing: Free tier available up to 10k monthly sessions. Growth, Pro, and Premier plans available at custom pricing.
PostHog
PostHog is an open-source, developer-first analytics platform that combines product analysis, feature flags, experimentation, and session replay.
It can be self-hosted or used in the cloud, which makes it particularly attractive for teams with data privacy or infrastructure requirements.
Best for: Engineering-led teams, startups, and companies needing EU data residency or full control.
Pricing: Free PostHog Cloud
Pendo
Pendo combines product analytics with in-app guidance tools like tooltips, onboarding flows, and feature announcements. This is especially useful for improving onboarding and feature adoption.
Best for: Mid market and enterprise SaaS teams that are focused on onboarding, adoption, and in-product messaging.
Pricing: Free starting tier, Custom pricing for Base, Core, and Ultimate.
Autocapture vs Manual Event Tracking
This is one of the most important product analytics decisions you’ll need to make in 2026.
At a high level, there are two approaches that can be used:
Autocapture
Used by tools like:
- Heap
- PostHog
- June.so
Autocapture records everything automatically, including clicks, page views, form interactions, and user flows. This enables you to then define events at a later point.
Pros:
- No upfront tracking plan needed
- Faster time to value
- Flexible product evolves
Cons:
- Creates noisy datasets
- Can lead to inconsistent definitions
- Requires cleanup over time
Best for: Early-stage teams still learning what matters.
Manual Event Tracking
This is used by tools like:
- Mixpanel
- Amplitude
Manual tracking needs engineers to define events in code prior to analysis.
Pros:
- Clean, structured data
- Consistent event taxonomy
- Strong governance
Cons:
- Slower to implement
- Risk of missing important events
- Requires ongoing engineering support
Best for: Mature teams with stable products and defined metrics.
Business Intelligence and Account Intelligence: The Strategic Layer
This layer connects data to decisions, combining internal performance insights with external signals to guide your team’s focus.
Best BI and Data Analytics Tools (AI-Native First)
SECTION 1: BI & DATA ANALYTICS (AI-NATIVE FIRST)
SECTION 2: ACCOUNT INTELLIGENCE PLATFORMS
SECTION 3: DATA ENRICHMENT (SEPARATE CATEGORY)
Business intelligence (BI) sits above product and marketing analytics. While those layers answer what happened, BI answers what it means for the business.
This is where forecasts are built, revenue is modeled, executive dashboards are created, and cross-functional data is unified.
However, it is important to understand that BI is powerful, but also heavy. For many SaaS companies, this often comes too early as well.
Hex Magic (AI-Native)
Hex Magic represents a fresh category of notebook-based BI with AI embedded directly into the analyst workflow.
Instead of switching between SQL editors, dashboards, and documentation, analysts can work in one environment where AI assists with query generation, data exploration, and analysis explanations. This makes it a powerful option for teams that already think in notebooks but want to move faster.
Best for: Data teams comfortable with SQL and notebooks that want AI embedded into analysis workflows.
Pricing: Individual plans: Community - Free, Professional - $36 per editor/month
Team plans: Team - $75 per editor/month, Enterprise - custom
Tableau Pulse (AI-Native Layer)
Tableau Pulse is Salesforce’s answer to the biggest limitation of traditional BI, which is accessibility.
Instead of users needing to explore dashboards manually, Tableau Pulse allows for automated insights, natural-language summaries, and personalized metric updates. This transforms it from a dashboard tool into a push-based insight system.
Best for: Existing Tableau users who want AI-driven insights without rebuilding their stack.
Pricing: Tableau starting at $15/month, Tableau Enterprise starting at $35/month.
Amazon Q in QuickSight (AI-Native Layer)
Amazon Q brings natural-language querying into AWS’s BI ecosystem. It means that users can ask questions in plain English, explore data without writing SQL, and generate charts instantly.
The major advantage here is tight integration with AWS infrastructure, which makes it the perfect fit for companies that are already active in that ecosystem.
Best for: AWS-native data stacks.
Pricing: Flexible pricing models available
Powerdrill Bloom (AI-Native)
Powerdrill Bloom is one of the more lightweight AI-native BI tools.
Its core strengths include NLP-to-SQL querying, automated insight generation, and “Chat-to-PPT” reporting workflows.
This makes it essential for teams that want fast answers and shareable outputs without building complex dashboards.
Best for: Small teams and lean operations that want AI-driven analysis without heavy BI setup.
Pricing: Free tier available, paid tiers begin ~$13/month
Microsoft Power BI
Power BI remains one of the most widely adopted enterprise BI tools. The strengths involved here include deep integration with the Microsoft ecosystem, strong data modeling capabilities, and relatively accessible pricing.
Copilot AI adds automation and summarization, but the core workflow is still reliant on traditional BI structures.
Best for: Organizations already embedded in Microsoft’s ecosystem.
Pricing: Free tiers, paid plans start from ~$14/month
Tableau
Tableau remains the benchmark for data visualization. It excels at custom visual storytelling, complex dashboards, and large-scale data exploration.
However, it comes with a steep learning curve and higher cost of total ownership.
Best for: Dedicated data teams building advanced dashboards.
Pricing: Tableau starting at $15/month, Tableau Enterprise starting at $35/month.
Looker
Looker is designed for companies that want to embed analytics directly into their product. Instead of building dashboards for internal use, Looker allows teams to model data centrally, deliver analytics to end-users, and maintain consistency across applications.
Best for: SaaS companies building customer-facing analytics features.
Pricing: Custom
Reality Check
BI tools are typically overkill when used for early-stage SaaS. This is because companies under ~$5m ARR generally don’t have enough data complexity, don’t require full warehouse modeling, and don’t benefit from heavy BI infrastructure. At that stage, product analysis and spreadsheets tend to be more effective.
Account Intelligence and Data Enrichment
BI is focused on internal performance, but account intelligence, on the other hand, focuses on external opportunity. It provides answers for who is researching your company, which accounts are in-market, and which companies do sales need to prioritize.
Account Intelligence Platforms
6sense
6sense is one of the leaders in account-based orchestration. It focuses on identifying activity in the ‘dark funnel,’ which is the research phase before prospects ever engage directly.
Best for: Enterprise SaaS companies running structured ABM programs.
Pricing: Price plans start from Free.
Demandbase
Demandbase combines account identification, intent data, and campaign orchestration. It is designed and built for companies managing large buying groups, complex enterprise deals, and multi-channel ABM strategies.
Best for: Enterprise ABM teams.
Pricing: Flexible custom pricing.
Cognism
Cognism positions itself as a GDPR-compliant alternative option to traditional data providers. The advantages of it include verified contact data, strong European coverage, and a compliance-first approach.
Best for: EU-based SaaS teams needing compliant prospecting data.
Pricing: Custom (quotes available)
Amplemarket
Amplemarket combines data enrichment with outbound execution. This enables teams to build lists, run outreach, and automate sequences, all within a single system.
Best for: Outbound-heavy SaaS teams.
Pricing: Startup plan - $600/month (annual term), Growth plan - custom pricing, Elite plan - custom pricing.
Leadinfo
Leadinfo focuses on identifying anonymous website visitors using IP-based tracking. It helps teams to uncover what pages they view, which companies visit their site, and when to trigger outreach.
Best for: SMB and EU-based B2B teams.
Pricing: Plans from $73/month
Data Enrichment Tools
Clay
Clay is often miscategorized as an account intelligence platform, but it actually isn’t. It is better understood as a data enrichment and workflow engine allowing teams to combine 75+ data sources, automate data workflows, and build custom enrichment pipelines.
Best for: Technical RevOps teams building custom data infrastructure.
Pricing: Free tier, Paid tier from $167/month
Clearbit (HubSpot)
Now a part of HubSpot, Clearbit is focused on account enrichment, visitor identification, and CRM data enhancement.
Best for: Teams already operating inside HubSpot’s ecosystem.
Pricing: Bundled with HubSpot tiers.
Intent Data: Honest Take
Intent data is one of the most overhyped and ultimately misunderstood categories involved in B2B analytics.
In theory, it identifies accounts that are actively researching solutions in your category before they contact you.
Sources include:
- Review platforms (G2, TrustRadius)
- Content consumption networks
- Third-party data providers
- Competitor site activity
The promise here is one that should resonate with a lot of businesses… find buyers before competitors do.
However, the reality is a little more nuanced and complicated. Intent data tends to favor larger companies with a more pronounced digital footprint, can generate false positives, and might miss smaller or earlier-stage buyers.
Importantly, it rarely works as a standalone signal.
Companies that build their entire GTM motion around intent data often over-invest in ABM, target the wrong accounts, and see weaker conversion rates than they expect.
The most effective use of intent data functions as one signal among many, rather than as a primary lead source.
The goal evolves again at this layer, where the focus is not just on understanding what has happened, but also deciding where to focus next. And this is where BI and account intelligence become strategic as opposed to purely analytical.
Conversion Analytics: Where Are Visitors Dropping Off?
Conversion analytics tools are designed to uncover the friction between traffic and signups, showing exactly where users hesitate, drop off, or fail to convert.
What Conversion Analytics Tools Do
Conversion analytics tools sit on top of your website and show the way visitors actually interact with it.
While marketing analytics tells you about where traffic comes from, and product analysis tells you what happens inside the product, conversion analytics is more focused on what occurs before somebody signs up.
This is the layer that answers questions such as where are users dropping off on your homepage? Where does your signup flow break? Why are visitors not clicking your primary CTA? What is happening on your pricing or demo page?
The core capabilities of this typically include:
- Heatmaps
- Session recordings
- Funnel analysis
- A/B testing
- Form analytics
Without this layer, conversion optimization becomes guesswork. You can see traffic and signups, but not the friction in between.
This is the reason conversion analytics works best alongside design and CRO frameworks. For deeper context, see Veza Digital’s guide to SaaS homepage design patterns, SaaS landing page examples, and CRO tools and experimentation frameworks.
These tools don’t replace strategy, but they surface the exact points where strategy breaks down in practice.
Best Conversion Analytics Tools
Below are some of the leading tools in this category, ranging from free entry points to enterprise experimentation platforms.
Microsoft Clarity
Clarity ranks as perhaps the strongest free option on the market. It provides unlimited session recordings, heatmaps, and basic AI-driven insights, which makes it unusually powerful for a no-cost tool.
The trade-off here comes with limited funnel analysis, no built-in surveys, and limited experimentation features.
Best for: Early-stage and growth-stage SaaS teams that want visibility without the issue of budget constraints.
Pricing: Free
Hotjar
Hotjar is the most established and widely adopted tool in this category. And its strength lies in combining quantitative and qualitative insight, where heatmaps and recordings are paired with surveys, feedback widgets, and funnel tracking.
This makes it the perfect choice for teams that want to understand user intent as opposed to just behavior.
Best for: Teams that want both behavioral data and direct user feedback.
Pricing: Free tier + paid plans
FullStory
FullStory operates at an enterprise level, focusing on high-volume session replay and advanced analytics.
The standout feature here is AI-driven anomaly detection, which surfaces atypical patterns automatically, as opposed to requiring manual analysis. It also supports compliance-heavy environments where data governance matters.
Best for: Enterprise SaaS with large traffic volumes and complex user journeys.
Pricing: Custom (enterprise)
VWO
VWO combines A/B testing with heatmaps and session recordings in a single platform. This makes it a strong choice for teams looking to move from insight to experimentation to validation without needing to switch tools.
Best for: Mid-market SaaS running structured experimentation programs.
Pricing: Enterprise, Pro, and Growth tiers available with custom pricing.
Optimizely
Optimizely is designed for experimentation at scale. It moves far beyond simple A/B testing and into feature experimentation, personalization, and statistically rigorous testing frameworks.
However, it requires a considerable traffic volume and operational maturity to justify.
Best for: Enterprise teams running continuous experimentation programs.
Pricing: Custom enterprise pricing.
Crazy Egg
Crazy Egg is a more lightweight and straightforward alternative to Hotjar. It’s focused on core features such as heatmaps and recordings with adding too much complexity.
Best for: Small teams that need quick insights without a heavy setup.
Pricing: Starts around $29/month
Heatmaps and Sessions Replay: What They Reveal
Analytics dashboards tell you what is happening, while heatmaps and session recordings tell you why. This is the key difference between the two.
Common patterns these tools uncover include:
- Users clicking on non-clickable elements, resulting in an expectation mismatch
- Rage clicks on form, leading to friction and broken UX
- Scroll drop-offs, which can cause content or layout issues
- Users skipping key sections entirely, causing poor hierarchy
- Mobile users zooming or mis-clicking, leading to poor responsiveness
These are insights that purely quantitative tools, such as GA4 or BI dashboards, are unable to surface.
For example:
- A funnel might show a 60% drop-off on a pricing page
- A heatmap may reveal that users never reach the pricing table
- A session replay could show confusion around billing options
That combination is what leads to meaningful optimization. Conversion improvements driven by these insights are significant, but widely reported lift percentages vary heavily depending upon source, and are frequently vendor-driven.
Privacy is a major consideration here.
The majority of modern tools, such as Microsoft Clarity and Hotjar will automatically mask personally identifiable information (PII), which makes them GDPR-compliant by default. Others might require manual configuration, particularly in more complex setups.
The goals shift again at this layer.
Marketing analytics tells you how people arrive. Product analytics tells you what they do after signup. Conversion analytics tells you why they don’t convert in the first instance.
Ultimately, in many SaaS businesses are where the fastest growth gains are found.
Recommended Analytics Stacks by Company Stage
The right analytics stack depends a lot on your stage, and what works at $500k ARR won’t work at $10M without the right underlying structure in place.
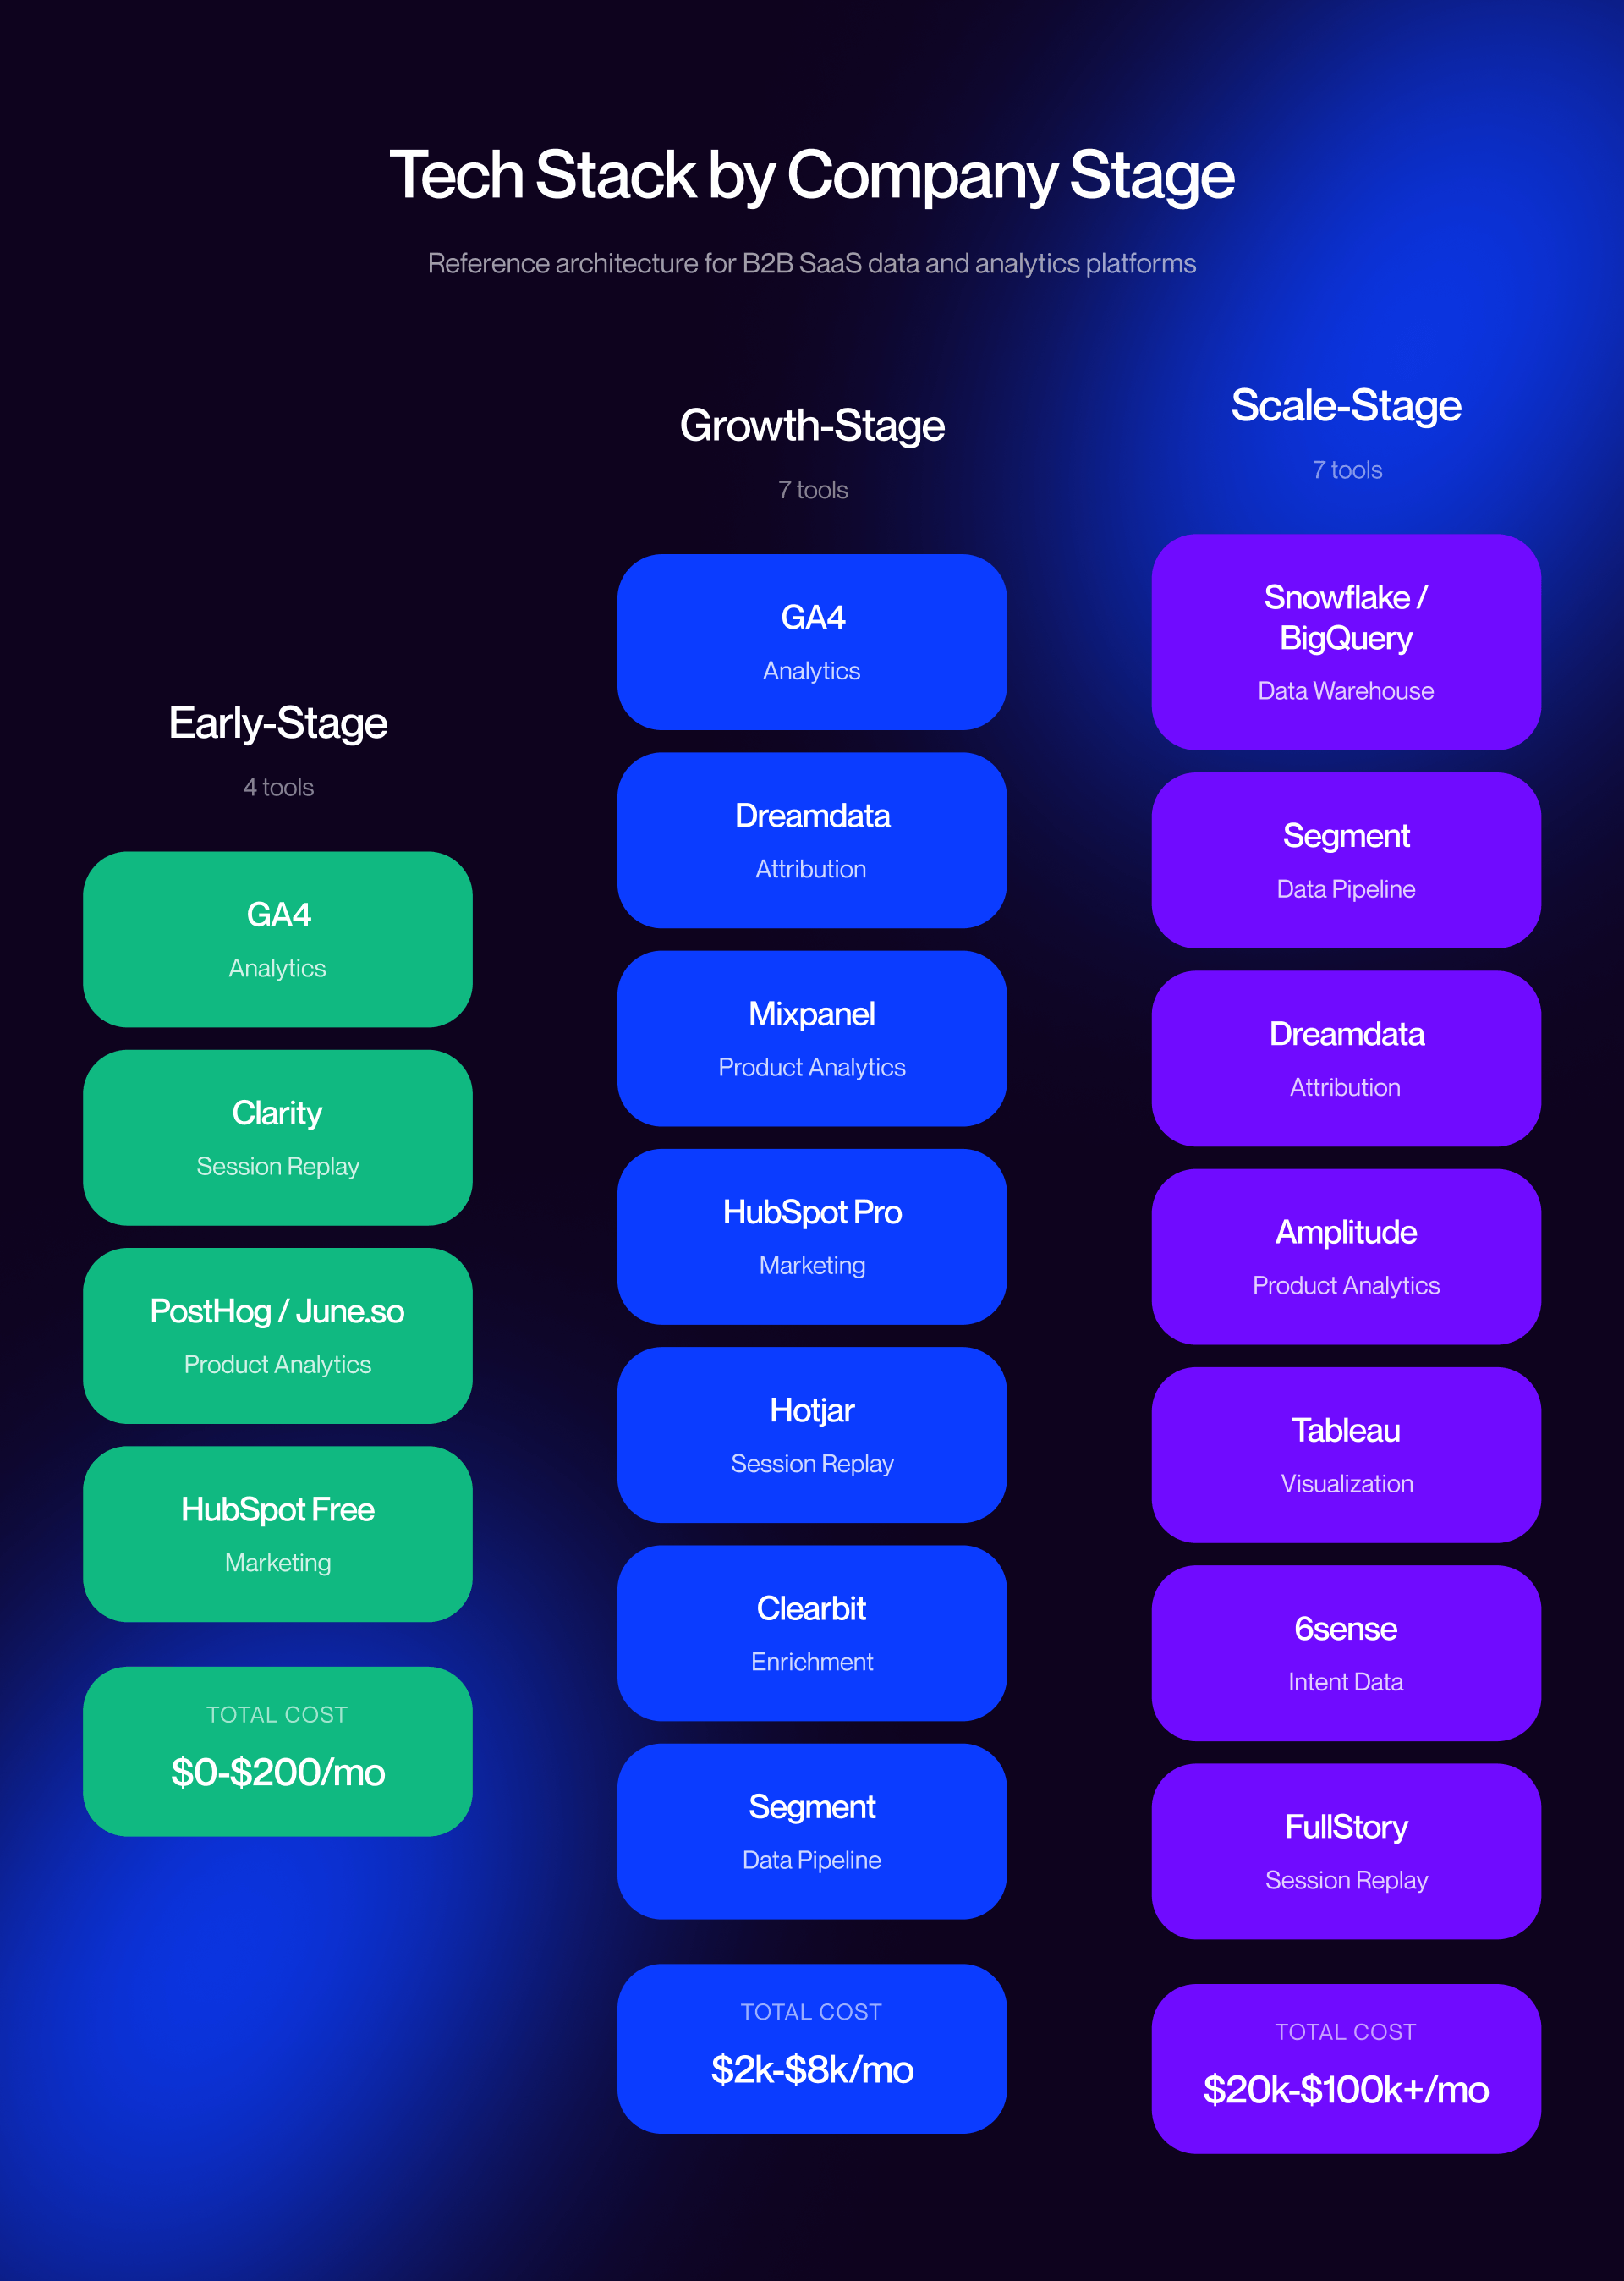
Early-Stage Stack ($0-1M ARR)
At the early stage of the process, the goal is signal quality over sophistication.
Most of the teams at this level do not require a complex attribution platform, a BI layer, or a warehouse. They need a clean baseline stack that’s able to capture traffic, basic CRM activity, website behavior, and early product usage without creating unnecessary complexity.
The recommended setup is:
- GA4 for web analytics
- Microsoft Clarity for heatmaps and session recordings
- HubSpot Free or Starter for CRM and basic email
- One product analytics tool: either PostHog or June.so
The product analysis decision depends on budget. PostHog is the best fit for a cost-conscious team that wants flexibility and self-hosting. June.so is the strongest option for teams that want AI-native insights without building dashboards manually.
Total costs range from roughly $0/month on the PostHog path, to a low-cost paid stack with June.so + HubSpot Starter path. Verify on vendor sites.
At this stage, skip marketing attribution. The volume is typically too low for multi-touch modeling to be reliable. Focus on making sure you get clean event data flowing and connecting with your core systems effectively. For setup guidance, this is where strong Webflow integrations matter the most.
Growth-Stage Stack ($1-10M ARR)
Growth-stage SaaS is where the stack begins to specialise.
At this stage, teams typically need more than surface-level reporting. They need to understand which campaigns influence the pipeline, how users behave after signup, where website friction exists, and which accounts deserve more focus.
The recommended growth-stage stack is:
- GA4
- A B2B attribution tool such as Dreamdata, HockeyStack, or HubSpot Marketing Hub
- Product analytics through Mixpanel or Heap
- HubSpot Marketing Hub Professional
- Conversion analytics through Hotjar or Clarity
- Account enrichment through Clearbit or a similar tool
If the company is running a serious ABM motion, 6sense or Demandbase can sit on top of that stack. This is also where CDP’s importance emerges. Segment or RudderStack centralizes event data before tools pull from it. Without this shared layer, the stack will disagree with itself.
Total cost is typically between $2,000 and $8,000 per month, depending on tool choice and traffic volume. At this stage, B2B-specific analytics decisions are more strategy-focused, making B2B marketing services more essential.
Scale-Stage Stack ($10M+ ARR)
At scale, the question is no longer surrounding which tool to buy, but has evolved into, how do we govern the system?
The recommended stack at this stage includes:
- A warehouse such as Snowflake or BigQuery
- BI through Tableau or Looker
- Enterprise attribution through Dreamdata or Adobe
- A dedicated data engineering function
- A CDP such as Segment or RudderStack
- Product analysis through Amplitude or Mixpanel Enterprise
- Account intelligence through 6sense or Demandbase
- Conversion analytics through FullStory
Total cost can range from $20,000 to $100,000+ per month, depending on company size, traffic, infrastructure, and headcount.
At this stage, governance becomes a big concern. Who owns each metric? Who can redefine events? How does the business avoid conflicting dashboards across marketing, product, and revenue teams? The CDP becomes the centerpiece, not any individual tool.
This is where implementation quality matters as much as tool selection. During redesigns and replatforming work, analytics setup often breaks unless it’s planned properly. This is where marketing strategy services, a strong Webflow agency partner, and the decision to get in touch before rollout can make the difference between a coherent stack and another reporting mess.
FAQs
What are AI analytics tools for B2B?
AI analytics tools use machine learning to analyze marketing, product, and customer data. They span five categories, including attribution, product analysis, BI, account intelligence, and conversion analytics.
What is the difference between AI-native and AI-sprinkled analytics tools?
AI-native tools are built around AI workflows from the start, while AI-sprinkled tools function as legacy platforms with added AI features. The difference affects usability, workflows, and long-term product direction.
What is the best AI analytics tool for B2B SaaS?
There is no single best tool. The right stack is dependent upon company stage and data maturity, as well as your biggest blind spot across marketing, product, or revenue analytics.
How much do AI analytics tools cost in 2026?
Costs can range anything from free tools like GA4 and mid-market tools that will cost hundreds monthly, all the way up to enterprise platforms that come with custom pricing. Always verify vendor pricing before you buy.
What is the difference between marketing analytics and product analytics?
Marketing analytics is responsible for tracking pre-signup activity like campaigns, while product analytics tracks post-signup behavior, such as feature usage.
What is the best free AI analytics tool for B2B?
There is no single best option on the market, but Microsoft Clarity, GA4, and HubSpot Free are some of the best examples that will cover early-stage analytics.
Should I use HubSpot or buy specialist analytics tools?
Use HubSpot for simplicity early on. Make sure you add specialist tools like Mixpanel or Dreamdata to help provide deeper insights on things like product analytics and conversion tracking.
What is multi-touch attribution and do I need it?
Multi-touch attribution distributes credit across the full customer journey. It’s useful for B2B SaaS, but requires sufficient data volume to be reliable.
Are there GDPR-compliant analytics tools for EU B2B SaaS?
Yes. Tools like PostHog, Cognism, Microsoft Clarity, and Hotjar support GDPR-compliant setups, though implementation details and handling still matter.
How do I integrate analytics tools with my Webflow website?
Be sure to use native integrations for GA4 and HubSpot, or install tracking scripts manually. For complex setups, using a CDP like RudderStack helps unify data across tools.
